

VRAM Meter
A clean in-game overlay for Windows. Your frame rate, frame generation, GPU, CPU and VRAM in one line across the top of the screen, readable over any game and never in the way.
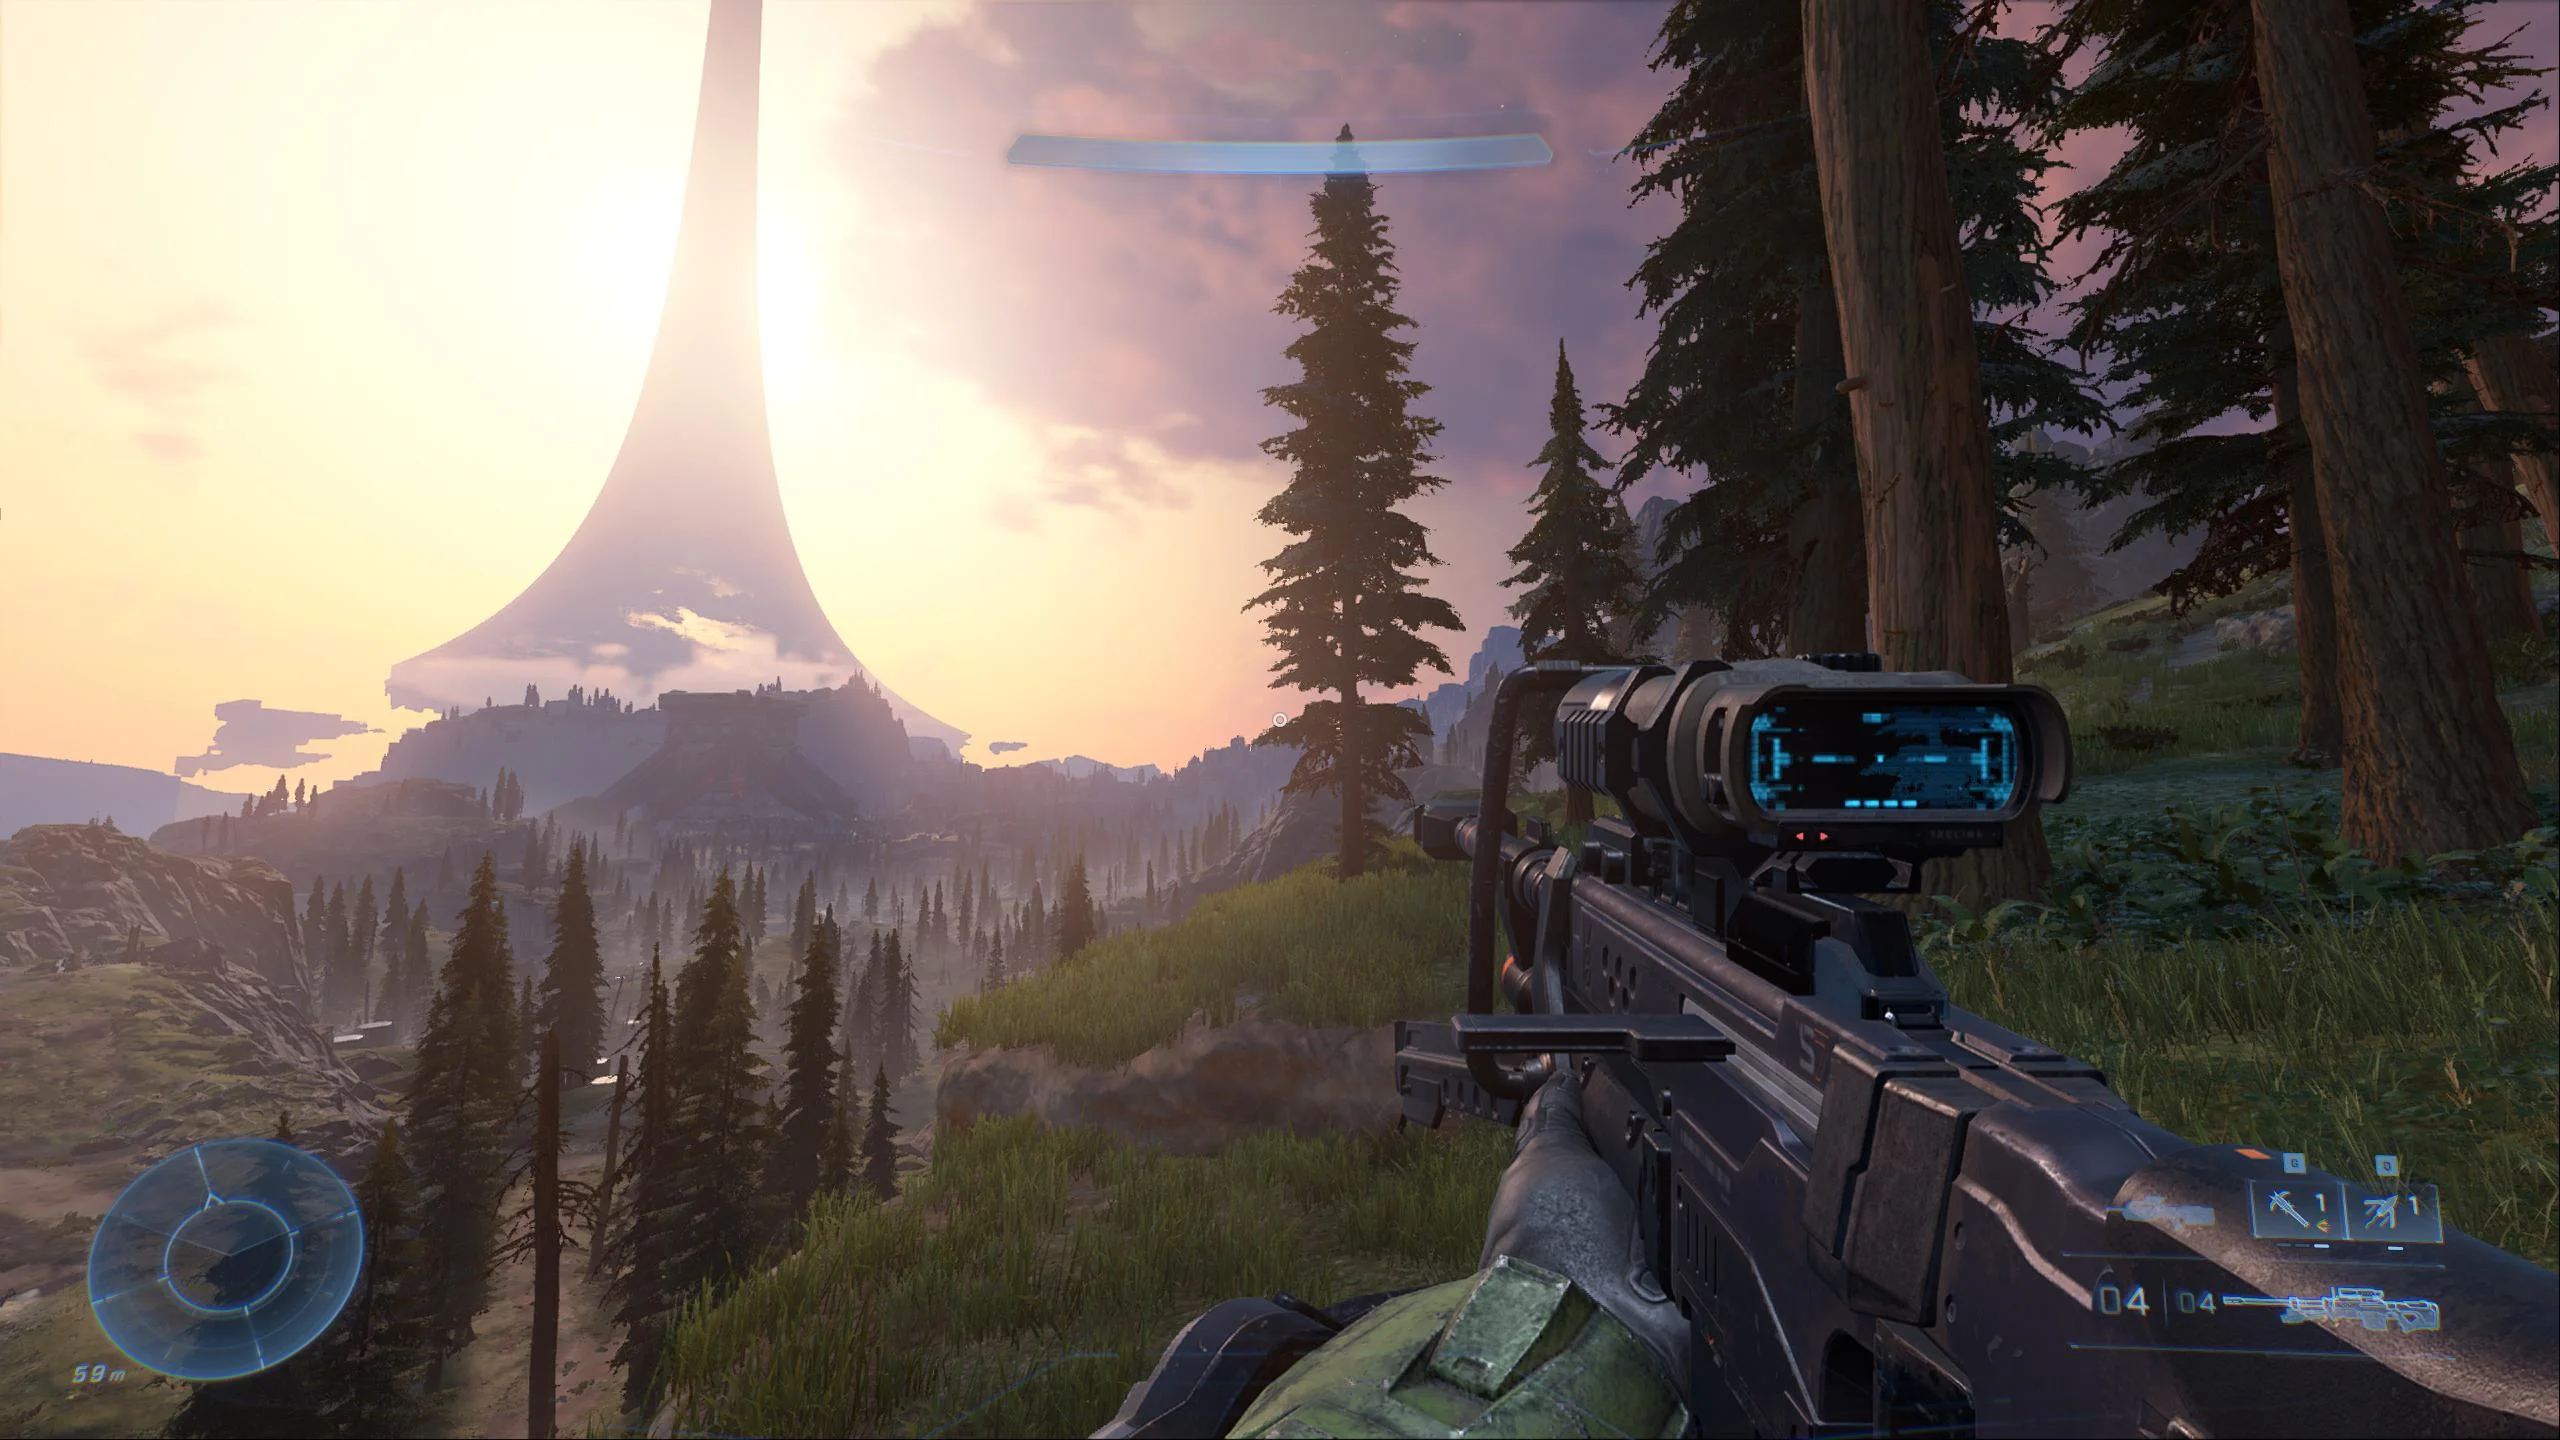
I started VRAM Meter to see where my graphics card’s memory was going. Along the way the overlay turned into the part I use every day: one line of numbers that tells me how a game is really running, without a cluttered panel over the action.
The overlay
- FPS and frame generation. The game’s frame rate, and how many of those frames are generated (DLSS Frame Generation, or FSR’s in games with Reflex). 50% is 2× frame generation, OFF is none.
- GPU, CPU and VRAM. How busy each one is, how much of the card’s memory is in use, and how much of it the game itself is holding.
- The display. Cable, resolution and refresh rate, so you can see at a glance you’re actually getting 240 Hz.
- Temperature at a glance. The GPU’s name is green while it’s cool, turns amber around 65 °C and red past 75 °C.
- Out of the way. Drag it anywhere and it snaps to edges and corners, or hold Shift to place it exactly. Every display gets its own, it never steals focus from the game, and Alt+O shows and hides it.
- Steady numbers. Every figure has a fixed-width slot, so nothing jitters as the values change.
Cool, warm, hot
The same line at three temperatures, shown close up: green at 52 °C, amber at 66 °C, red at 75 °C with the card at 100%.
With no game running it stays on the desktop too, down to GPU, CPU, VRAM, the display and the GPU.

The VRAM meter
Open the window for the full picture: every app holding GPU memory, counted by what actually sits in the card’s own memory, with the biggest game measured against everything else. Click an app to measure it instead, or end one you don’t need right from the list.
Under the meter are the GPU’s vitals (use, temperature, power, clocks, fan, PCIe link and driver, with a daily check for a newer NVIDIA driver) and every monitor plugged into it. The tray icon is a small live meter too.
Safe by design
- Runs as you, never as administrator, and won’t touch Windows’ own processes or services.
- Ends an app only after you confirm, and only after checking it’s the same process you picked.
- No server. It goes online for two things, a daily check for a newer NVIDIA driver and a check every few hours for a new version of itself, and you can turn off either one. An update installs only when you click it, and only if the download matches the release.
Download
- File
- VramMeterSetup.exe, 71 MB
- Runs on
- Windows 10 and 11 (x64)
- Install
- Just for you, no admin needed
- Updates
- Built in, one click when a new version is out
- Version
- 1.0.1
Built with
- Language
- C# on .NET 10
- VRAM
- Windows’ GPU memory counters, per app and per GPU
- GPU utilization
- Windows’ GPU engine counters, per app and per GPU
- FPS
- Event Tracing for Windows, read with Microsoft’s TraceEvent library
- Frame generation
- NVIDIA Reflex’s latency markers (PCLStats)
- GPU vitals
- NVML, NVIDIA’s monitoring library, and DXGI
- Monitors
- DDC/CI, to switch a monitor’s input